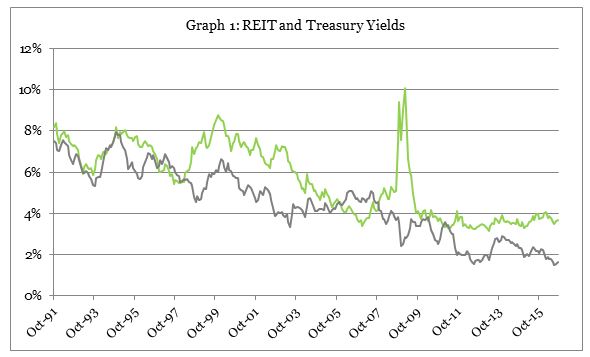
As of the end of September 2016 the average dividend yield for stock exchange-traded Equity REITs was 3.70%. That’s extremely low by historical standards: in fact, the average Equity REIT yield has been greater than 3.70% nearly 90% of the time stretching all the way back to the beginning of 1972. The reason that equity REIT yields have been so low, of course, is that we’re in a low-interest-rate environment: a dividend yield that’s low by the standards of equity REITs is high by the standards of, well, practically every other asset on Earth.
In such a low-rate environment, while the dividend yield continues to be valuable for income-oriented investors, it isn’t as useful an investment metric as it normally would be for total return-oriented investors interested in future capital appreciation as well as future income. Instead, total return investors may be better off using a relative metric: the yield spread, or the difference between average Equity REIT dividend yields and the market yield on U.S. Treasury securities. Graph 1 shows the monthly market yield on 10-year U.S. Treasury securities along with the monthly average Equity REIT yield over the past 25 years. Both have maintained generally downward trajectories (remember the early ‘80s—big hair and big interest rates?), but notice that Treasury yields have declined more surely than REIT yields.
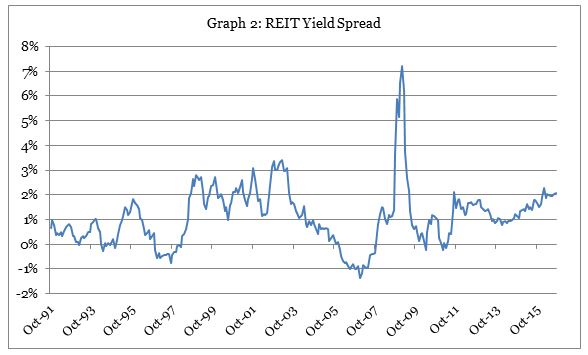
As a result, as Graph 2 shows, the yield spread has maintained a generally upward trajectory over the same 25-year period:
Look at those periods when the yield spread was negative: basically all of 1997, plus late 2005 through late 2007. Each of those preceded a significant decline in Equity REIT total returns: that is, yield spreads became negative at times when forward-looking total returns (mainly price appreciation) turned out to be poor. Does that mean that yield spreads have provided a signal that investors can use to make tactical decisions?
There are no guarantees in life, of course—and least of all during a period of literally unprecedented central bank intervention such as the one we’re navigating now. To the extent that history is any guide, however, the answer seems to be yes: historically there has been a fairly consistent relationship between current Equity REIT yield spreads and forward-looking Equity REIT total returns. To see this, I divided all the months over the past 25 years into six roughly equal categories according to the magnitude of the Equity REIT yield spread at the end of the month. About one-sixth of the time the yield spread was negative; the other categories were 0%-0.6%, 0.6%-1.0%, 1.0%-1.5%, 1.5%-2.0%, and greater than 2.0%. Then I computed the forward-looking total returns over the next one year and (annualized) over the next two, three, four, and five years using the FTSE NAREIT All Equity REITs Index. Graph 3 shows the results for forward-looking four-year periods:
When Equity REIT yield spreads were negative, as they were in 1997 and again around 2006, forward-looking Equity REIT total returns tended to be disappointing: positive on average, but by only 2.68%. When yield spreads were higher, though, forward-looking total returns tended to be higher as well: in fact, when yield spreads averaged 2.0% or more, returns over the next four years averaged an amazing 21.13% per year.
The technique worked for one-, two-, three-, and five-year forward periods as well, though not quite as reliably. It also worked quite well using median annualized total returns instead of average annualized total returns. In fact, it also worked if I used historical data all the way back to the beginning of 1972; the two reasons that I cut it off at 25 years of historical data are (1) that it doesn’t seem likely that we’ll again see Treasury yields in the neighborhood of 15%, as we did in the early ‘80s, and (2) that the early ‘90s marked the beginning of what we now call the “modern REIT era,” and generally I think that comparisons over the modern era are more reliable than comparisons with the “pre-modern era.”
The most important reason to invest in REITs, however, is not simply because total returns have been so strong over such a long historical period: instead, it’s because the real estate market cycle that drives REIT returns is so different from the business cycle that drives returns in most of the non-REIT part of the stock market. Given that big difference between the real estate asset class and the (non-REIT) equities asset class, could the Equity REIT yield spread also give investors a way to make tactical adjustments to their portfolios?
Yes: again, no guarantees, but the REIT yield spread has historically done a pretty good job of telling which asset class was likely to outperform over forward-looking periods, REITs or the broad stock market. Graph 4 shows the average or median total return over the next 1-, 2-, 3-, 4-, and 5-year periods for exchange-traded Equity REITs relative to the Russell 3000 index of the broad stock market. When Equity REIT yield spreads were negative, forward-looking Equity REIT total returns weren’t necessarily negative (Graph 3) but generally they were less than returns in the non-REIT part of the stock market. But when Equity REIT yield spreads were positive—especially when they were in the range of 1.5% to 2.0%, or greater than 2.0%—forward-looking Equity REIT total returns were usually not only positive (Graph 4) but also generally much greater than returns in the broad stock market. In fact, when the average Equity REIT yield spread exceeded 2.0%, on average the total returns to Equity REIT investors outpaced the total returns to broad stock market investors by more than 12% per year over the next four years!
Bottom line: the current Equity REIT dividend yield spread relative to U.S. Treasuries is abnormally high at 2.04% (as of September 30th), and when the yield spread has been unusually high in the past, that situation has generally been a signal that Equity REIT total returns in the future—and the outperformance of Equity REITs relative to the broad stock market—would be abnormally strong over the next several years.


