Commercial property prices have risen steadily since the beginning of the recovery from the Great Financial Crisis (GFC). Prices through September were nearly 25 percent above the level at the end of 2007, according to the value-weighted CoStar Commercial Repeat Sales Index, while prices of multifamily properties were nearly 50 percent above their end-2007 value.
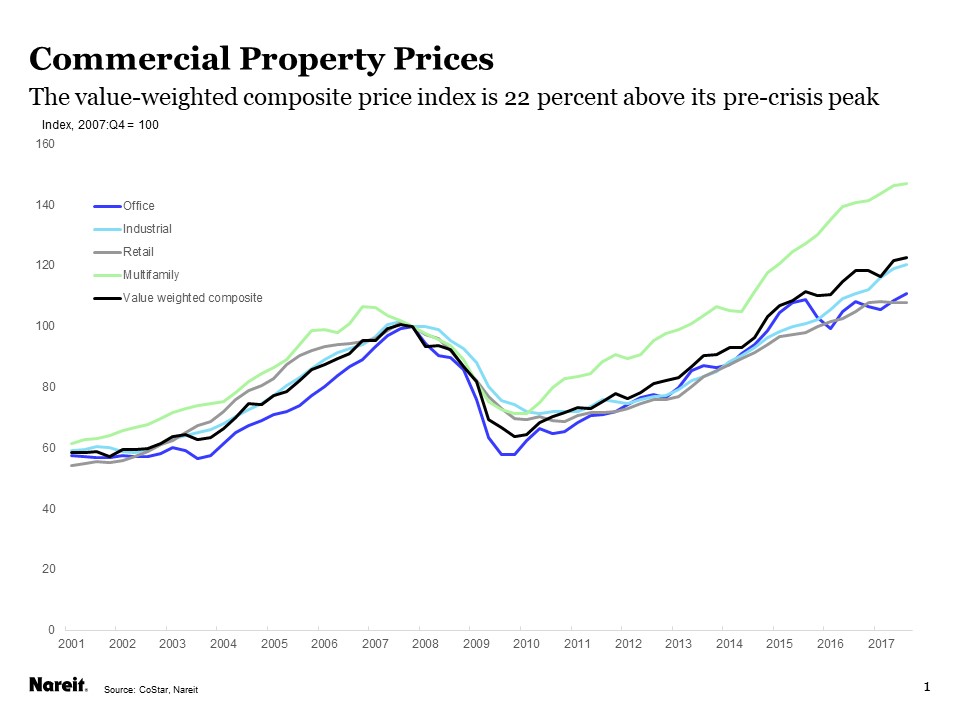
Continued price gains, however, at some point begin to raise warning flags. The value-weighted CoStar Composite index has nearly doubled in the seven-plus years since it bottomed out in early 2010, which begs the question, how frothy are property prices? One way to address this issue is to decompose price gains into two components. One part of price increases is that which is supported by rising NOI, while another component results from changes in cap rates. The increases associated with NOI growth have a solid foundation in fundamentals, and generally do not signal trouble ahead. Price increases that result solely or mainly from cap rate declines, however, have proven to be less sustainable over the course of a real estate cycle. Since cap rates are simply the ratio of NOI to property price, the decomposition of price increases into these two components is a straightforward calculation.
Let’s look at a series of four charts that plot the NOI and cap rate components of price increases, calculated from the CoStar data for the national Office, Retail, Apartment and Industrial property markets.
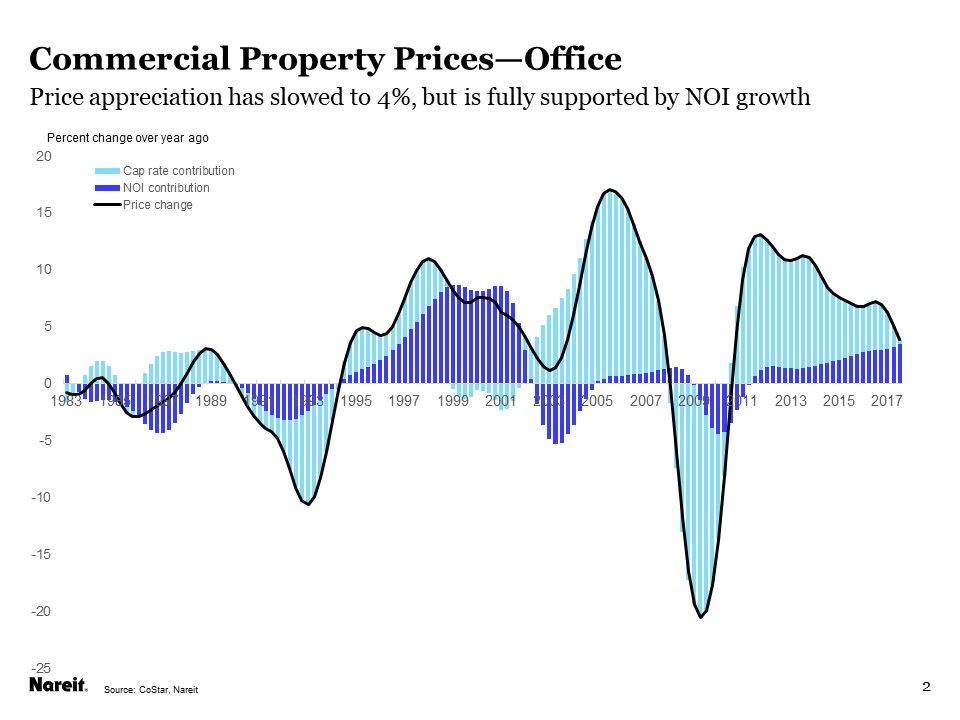
Nearly all the increase in office property prices over the past four quarters has been associated with higher NOI . The NOI contribution has steadily risen in recent years, whereas the price gains earlier in the decade were largely driven by cap rates recovering from the price declines suffered during the GFC;
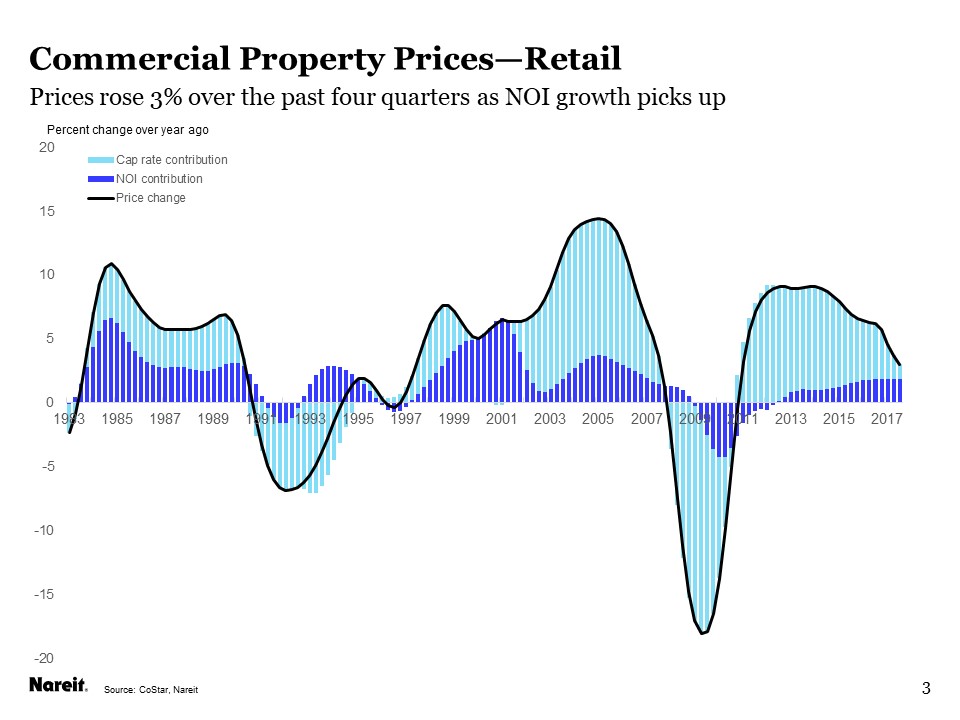
Retail properties, similar to office, also saw price gains mostly due to cap rate declines early in the decade, but the appreciation over the past year or so has been mostly due to NOI growth—cap rate compression accounted for about one-third of the total price increase over the past four quarters;
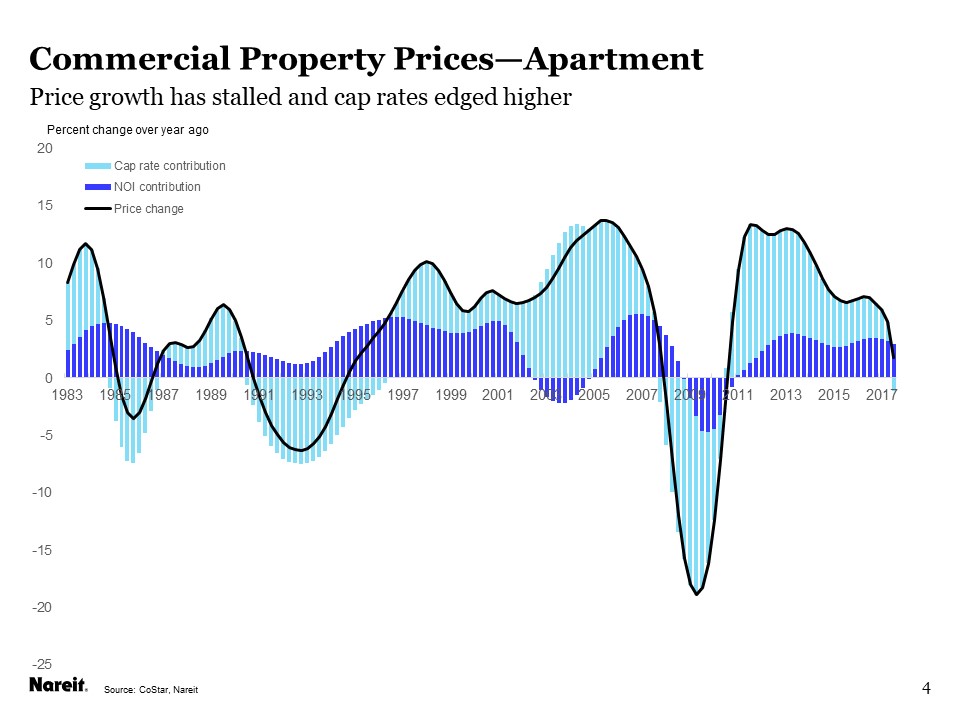
Apartment markets saw a slight increase in cap rates, which offset a portion of the gains coming from NOI. NOI growth in the apartment sector has maintained a solid 3 percent trend since 2012; and
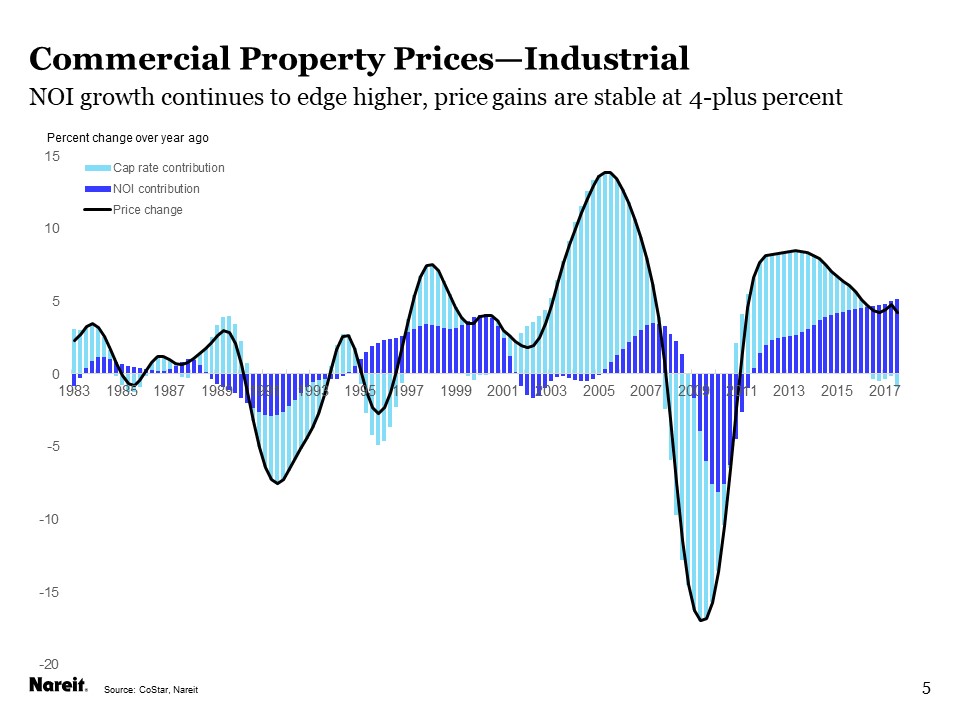
Industrial properties also had an uptick in cap rates. With NOI growth exceeding 5 percent, however, prices continue to climb at four to five percent per year.
Over the past four quarters, a majority of the price increases in the major property sectors have been attributable to higher NOI. This provides some comfort against the worries of “frothy” CRE valuations. Real estate markets are still exposed to potential cap rate increases, however, especially as the Federal Reserve plans to raise its target for short-term interest rates further in the months ahead while also letting its holdings of long-term Treasury and Agency securities shrink.
Cap rates do rise and fall over the real estate cycle, and will almost certainly move above their current ultra-low levels. In past cycles, cap rates have generally risen by less than 100 bps over a period of a few years (the GFC was an exception, and cap rates rose 200 bps or more over a year or two). We can reverse the calculation used for the price decomposition above, to gauge how prices might respond to potential future cap rate increases.
The results of this exercise demonstrate that property prices have some vulnerability to higher cap rates. For cap rate increases comparable to what have occurred in the past, however, the risks are modest. For example, if cap rates in the office market were to rise 25 bps over one year while NOI maintained its recent growth of 3.5 percent, prices would be little changed, either up or down. A 50 bp rise in cap rates over two years with trend NOI growth would similarly result in flat prices. Larger or more rapid increases in cap rates, however, would imply a decline in property prices, unless NOI growth were to accelerate. For example, a 100 bp increase in cap rates—which is larger than increases during any period outside of the GFC—could translate into price declines of 10 percent or more, unless the cap rate rise took place over a period lasting four years or longer.
Another factor helping buffer property prices is the spread between cap rates and long-term interest rates. Cap rates may not rise in lock-step with interest rates, as the spread between cap rates and long-term interest rates currently is unusually wide. To a certain extent these wide spreads came about as the Fed’s purchases of Treasury securities drove down long-term interest rates without having a corresponding impact on cap rates. One might anticipate, therefore, that cap rate compression may absorb a good portion of any rise in long term rates as the Fed’s portfolio runs off.
Commercial property prices do appear to be well grounded, in light of the evidence presented above. Recent price gains have been mostly attributable to rising NOI, which is a sustainable form of price increase; prices have modest exposures to rising cap rates, but the wide spread between cap rates and long-term interest rates may buffer the impact of rising rates.