The global footprint of REITs and listed real estate allows real estate investors to geographically diversify easily and with low transaction costs. Today, there are 40 countries and regions with REIT regimes and 40 countries with REITs or listed real estate represented in the FTSE EPRA/Nareit Global Index providing a wide geographic distribution of real estate returns. Like other equity investments, REITs and publicly-listed real estate around the world were hit hard by the onset of the COVID-19 pandemic, but have generally rebounded strongly with the development of therapeutics to fight the virus. Not all property sectors or regions were impacted as negatively, nor have they bounced back uniformly. As previously noted, work from home trends and e-commerce behavior at the beginning of the pandemic benefited the digital economy sectors of the real estate market.
The digital economy has been recently a focus of Nareit, along with index partners FTSE Russell and EPRA. During the past few years, the index partners introduced a new U.S. tech-focused index (the FTSE Nareit New Economy Index - PDF), debuted a new global index with a broadened scope that includes communications towers and timberlands (the FTSE EPRA/Nareit Global Extended Index series - PDF), and broadened the coverage of the investable data center market by modernizing the ground rules for the existing global index to clarify that interconnection revenue is considered relevant real estate revenue.
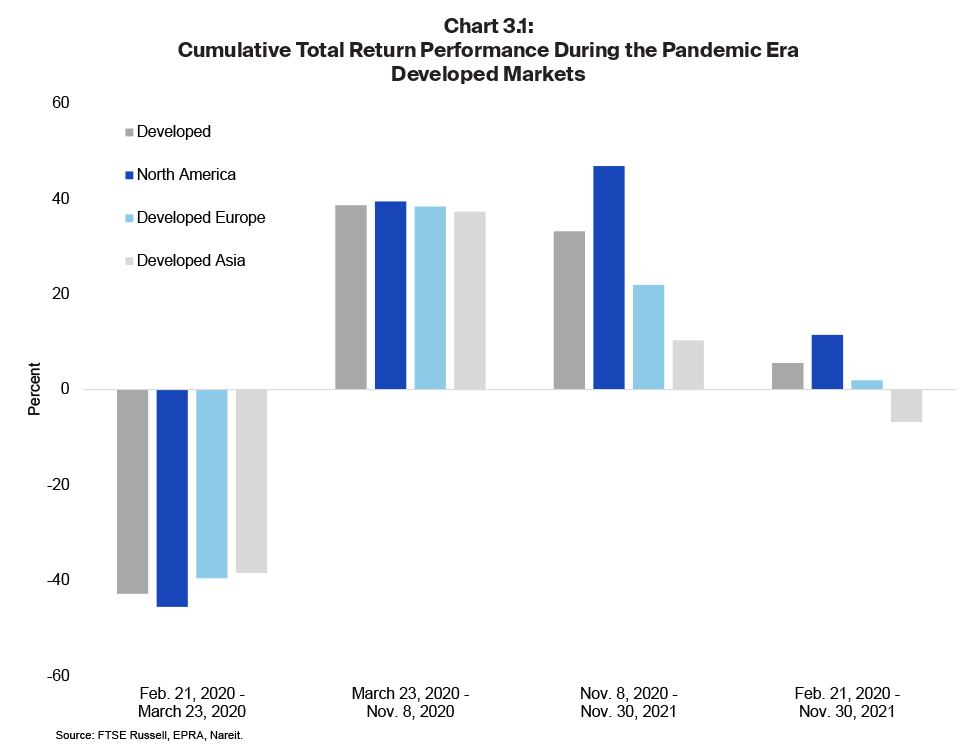
As shown in chart 3.1, during the first two phases of the pandemic, global regions responded rather uniformly, with North America declining -45.6%, Europe declining -39.6%, and Asia declining -38.5% from Feb. 21, 2020 – March 23, 2020. From March 23, 2020 – Nov. 8, 2020, the regions rebounded similarly with total returns of 39.5% for North America, 38.4% for Europe, and 37.3% for Asia. From Nov. 8, 2020 – Nov. 30, 2021, the regions begin to show notable divergence. Over this period, North America posted a total return of 46.9%, compared to 21.9% for Europe, and 10.3% for Asia.
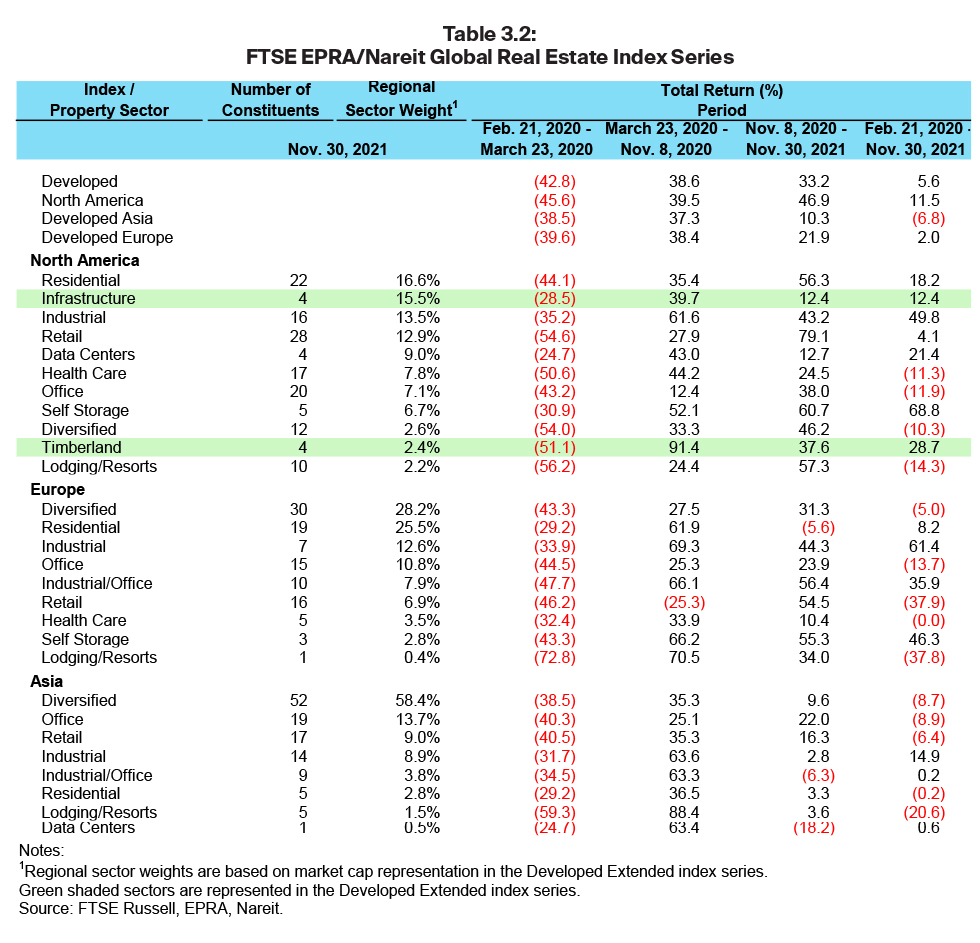
Table 3.2 provides detail at the sector level that offers some insight into comparative regional performance. In North America, the five highest weighted sectors are all positive over the course of the pandemic, with total returns of 18.2% for residential, 12.4% for infrastructure, 49.8% for industrial, 4.1% for retail, and 21.4% for data centers. Conversely, in Asia, the three highest weighted sectors are negative over the course of the pandemic, posting total returns of -8.7% for diversified, -8.9% for office, and -6.4% for retail. Europe’s results were mixed with diversified as the highest weighted sector posting a -5.0% total return over the course of the pandemic, and the next two highest weighted sectors, residential and industrial, posting positive returns of 8.2% and 61.4%, respectively.
Retail and office serve as another useful comparison across regions. In the U.S. and Asia, the retail stock recovery began during the March to November 2020 period, while the European retail sector did not begin recovering until after the November 2020 vaccine-driven reopening recovery. Retail is the fourth-largest sector in North America and overall has turned modestly positive since the beginning of the pandemic, but remains well below the pre-pandemic level in Europe, while remaining moderately lower in Asia. Despite different patterns of work from home and office attendance, globally the office sector has posted relatively consistent returns across regions. As the office sector has lagged many other sectors, the difference in regional weight is important—in Asia, office is the second largest sector comprising 14% of the region; it comprises 11% in Europe; and 7% in North America.
Further worth noting is that industrial performed well in all regions, with an extraordinarily strong performance in North America and Europe, where it makes up approximately 13% of each region, and approximately 9% in Asia. Similarly, residential turned in a strong performance in North America and Europe as one of the largest sectors in each region. Results were flat in Asia where residential makes up only 3% of the market. An additional takeaway from a review of sector performance is that the diversified sector performed similarly negatively across all regions; it is the largest sector in Asia and Europe, while making up only 3% of the North American market.
Finally, infrastructure represents approximately 16% of the Developed Extended index in North America, but is not yet represented in other regions; similarly, data centers are 9% in North America, less than 1% in Asia, and are not represented in Europe, while self-storage has performed well in North America and Europe, but is not represented in Asia.
An important takeaway from global returns over the pandemic period has been the benefit of broad diversification across property sectors along with the reminder that REITs and publicly listed real estate serve as foundational components of a well-balanced, diversified portfolio.

