Investment real estate values increased by +4.4% during June 2016 according to the FTSE NAREIT PureProperty® Index Series, which provides the earliest measurement of changes in the market values of properties held for investment purposes. The South region saw the strongest appreciation at +5.1% but properties appreciated strongly in other regions as well with implied values up +4.8% in the Midwest, +4.0% in the East, and +3.6% in the West.
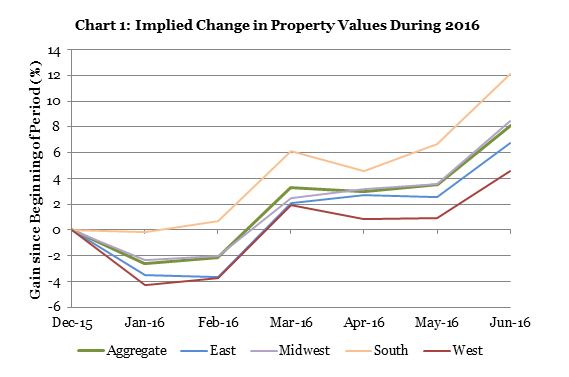
Property value appreciation nationwide averaged +4.7% during the 2nd Quarter and +8.1% during the first half of 2016. Appreciation during 2016Q2 was strongest in the Midwest region at +5.8% followed closely by the South at +5.6% and the East at +4.5%, with the West lagging slightly at +2.6%. Over the full year to date, however, as Chart 1 shows, properties in the South region have appreciated at a very robust +12.1% followed by the Midwest at +8.5%, the East at +6.7%, and the West at 4.6%.
With distributed income from property investments averaging +0.5% nationwide, total returns averaged +4.9% during June; over the first six months of the year, however, strong income and strong property appreciation combined to provide total returns averaging +10.3%. Year-to-date total returns have been strongest in the South region at +14.5% with the Midwest at +11.1%, the East at +8.7%, and the West at +6.4%.
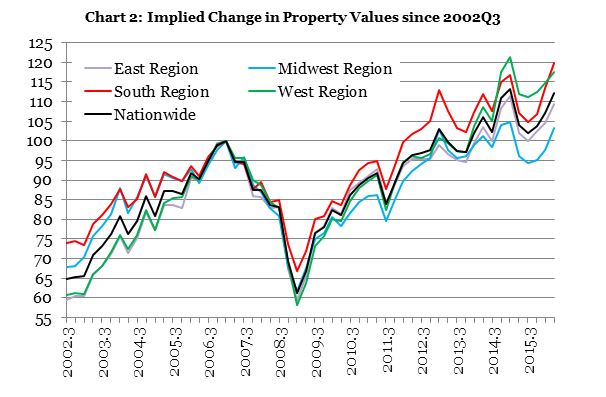
The PureProperty Index Series, launched in 2015, provides a daily measure of U.S. real estate price and total returns at the level of both property (unlevered) and equity investments. The index series infers changes in the market values of apartment, health care, hotel, industrial, office, and retail properties owned by stock exchange-listed U.S. equity real estate investment trusts (REITs) by relating observed changes in stock prices to the property holdings of each REIT and correcting for the effect of each REIT’s capital structure. As Chart 2 shows, over the full historical period since 2002Q3, including the financial crisis of 2008-09, properties have appreciated most strongly in the West and East regions at 4.9% per year and 4.5% per year, respectively, with volatilities of 11.9% and 12.1%. Appreciation has been slightly lower on average in the South and Midwest regions at 3.6% per year and 3.1% per year respectively, but also less volatile at just 10.3% and 10.8%.
Because it evaluates returns by geographic region as well as by property type, the PureProperty index series can help investors take advantage of performance differences among targeted segments of the U.S. property market through diversified exposure to properties in each segment. During June, for example, retail properties in the South and Midwest regions significantly outperformed those in the East region, with implied property values increasing by an average of +7.3% in the South Region Retail segment and +6.4% in the Midwest Region Retail segment compared to +4.5% for the East Region Retail segment, and total returns averaging +8.0% and +6.8% compared to +4.9% respectively. Similarly, over the first six months of the year apartment properties in the Midwest region have outperformed those in the other three regions with implied appreciation averaging +6.2% in the Midwest Region Apartment segment compared to +3.4% for West Region Apartment, +2.9% for East Region Apartment, and +2.5% for South Region Apartment.
Equity total returns measured by the PureProperty Index Series (+6.8% during June and +12.6% during the first half of the year) fell slightly short of equity returns measured by the FTSE NAREIT Equity REIT Index (+7.0% and +13.4%), reflecting especially strong performance among equity REITs holding single-family home rental properties (+11.9% and +25.0%) and manufactured home communities (+10.3% and +18.1%), which are not constituents of the FTSE NAREIT PureProperty Index Series.

