Listed U.S. REITs returned +7.53% during January 2015 according to the FTSE NAREIT All REIT Index, which measures the total returns (stock price appreciation plus dividend payments) of all REITs traded on major stock exchanges in the U.S. In contrast, the broad U.S. stock market suffered a decline at -1.47% according to the Dow Jones U.S. Total Stock Market Index. Small-cap value stocks—sometimes mistakenly considered similar to REITs—did even worse at -2.11% according to the Russell 2000 Value Index, while large-cap stocks also underperformed at -1.73% according to the S&P 500 Index. In fact, REITs were among very few bright spots in the stock market during January: even the Financials sector, in which REITs have been nominally classified, suffered a strong decline at -5.37%.
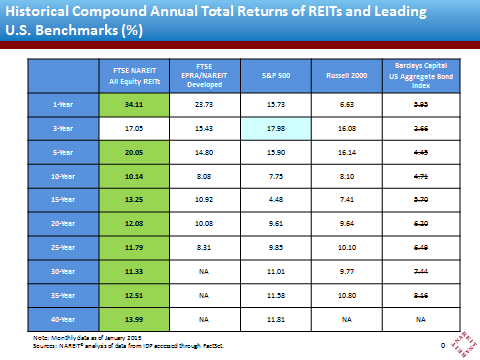
The chart below compares the long-term returns of listed U.S. equity REITs—the nine-tenths of the REIT market that primarily owns buildings and other physical assets—to returns on their non-U.S. counterparts as well as to U.S. investments in large-cap stocks, small-cap stocks, and bonds. Listed U.S. equity REITs have provided stronger average total returns than all of the other asset classes over the past 1-, 5-, 10-, 15-, 20-, 25-, 30-, 35-, and 40-year periods.

The listed U.S. equity REIT market is now 8 years into the real estate market cycle that began with the market peak near the end of January 2007. As the chart below shows, the most recent complete real estate market cycle lasted 17½ years (from August 1989 through January 2007) with total returns for listed U.S. equity REITs averaging +14.3% per year; the previous complete cycle lasted 17 years (from September 1972 through August 1989) with total returns averaging +13.9% per year. Owing to the severity of the downturn and liquidity crisis in 2007-2009, average total returns during the current market cycle have averaged just +4.9% per year.