Market interest rates rose sharply over the second half of 2016: for example, the market rate on 10-year Treasury bonds increased from just 1.37% on July 3rd to 2.45% on December 31st. The Federal Open Market Committee (FOMC) increased its key Fed Funds rate in December, and even with the FOMC having decided in early February to hold policy rates steady, the futures market implies a belief among market participants that policy rates will be increased further during 2017.
My colleague Calvin Schnure published a market commentary last month noting that exchange-traded Equity REITs have reduced total debt, locked in low interest rates through fixed-rate debt, and taken other measures to position themselves from any rise in interest rates. As a complement to Calvin’s analysis, in this commentary I’ll review the historical relationship between rising market interest rates and the returns on exchange-traded REITs.
It’s important first to point out the significant difference in business models between Equity REITs and Mortgage REITs. Equity REITs own primarily real assets: income-producing properties such as office buildings, apartment communities, infrastructure and the like; in addition to common and preferred equity financing, most of them also borrow some amount of money at fixed or variable interest rates to purchase those real assets, and they may use secured debt (mortgages) as well as unsecured debt such as corporate bonds or bank lines of credit. Mortgage REITs own primarily financial real estate assets: mortgages secured by real properties, or mortgage-backed securities; in addition to their equity, they too borrow money to purchase those financial assets, and an important piece of their business is to hedge against the risks of any change in interest rates as it would affect both their funding costs and their expected gains.
Here’s the myth: an increase in interest rates is bad for real estate investors. Here’s the empirical fact: the historical evidence shows that real estate investors—at least those who invest through exchange-traded REITs—have usually done better during rising-rate environments than when interest rates were declining. There's a perfectly good reason for that: interest rates usually increase because macroeconomic conditions are improving, and an improvement in macroeconomic conditions is usually good news for equity investments in both real estate equity and real estate debt.
So let's look at the historical record. First, which data should we use? Lots of attention is paid to changes in policy rates, especially the Fed Funds rate, but it can be tricky to evaluate the connection between policy rates and asset returns, for two reasons. First, policy rates change infrequently: the FOMC, for example, meets only about every six weeks—and even though an FOMC decision can be announced between meetings, those occurrences are rare. Second, many investors try very hard to predict changes in policy rates while others respond after the fact, so the effect on asset prices may be felt over a period from several days before to several days after the announcement.
I prefer to look at market interest rates, which change every day on the basis of the same changes in expectations that investors also use to make investment decisions on assets of all types. The Federal Reserve publishes daily values for the market yield on 10-year U.S. Treasury bonds going back to the beginning of 1999, which is the earliest that daily returns for exchange-traded U.S. REITs started being recorded by the FTSE NAREIT All Equity REIT Index and the FTSE NAREIT Mortgage REIT Index. From that date through the end of January 2017 there were 2,026 market trading days when the market yields on 10-year Treasuries increased and 2,165 days when they declined (plus 323 when they remained constant). Here's how things worked out for investors in exchange-traded U.S. REITs:
- For Equity REITs, the average total return (and the median) was
- +0.32% (+0.20%) on days when the market yield on 10-year Treasury bonds was increasing, and
- -0.20% (-0.05%) on days when it was declining.
- For Mortgage REITs, the average (and median) total return was
- +0.18% (+0.15%) on rising-rate days compared to
- -0.12% (+0.05%) on declining-rate days.
In other words, over the available historical time period, investors in both Equity REITs and Mortgage REITs have typically fared even better on days when interest rates have risen than when they've declined. Again, the reason is no secret: interest rates generally go up because macroeconomic conditions are improving, and improving macroeconomic conditions generally cause real estate assets—both equity and debt—to become more valuable.
It helps to examine this sort of question from several different angles. Many REIT investors pay closer attention to the market yield on Baa-rated corporate bonds, reasoning that it more closely reflects REITs’ borrowing costs. The corporate bond market is less liquid than the Treasury bond market, so there are many more days when no change was recorded: 606 over the same historical period, compared to 1,883 rising-rate days and 2,055 declining-rate days. Still,
- For Equity REITs, the average total return (and the median) was
- +0.23% (+0.14%) on days when the market yield on Baa-rated corporate bonds was increasing, and
- -0.14% (-0.01%) on days when it was declining.
- For Mortgage REITs, the average (and median) total return was
- +0.12% (+0.14%) on rising-rate days compared to
- -0.06% (+0.08%) on declining-rate days.
The main prospect that has been concerning investors is not a shot-term increase in interest rates but a sustained rise, so here’s another way to look at the historical record. I used the daily market yields (on 10-year Treasuries) to identify every period of at least two months when rates were generally increasing. I found 15 of them, and simply recorded the total returns for exchange-traded Equity REITs and Mortgage REITs over each period of sustained increase. (The returns are annualized simply for comparison because the periods are of different lengths; in general it’s a good idea for investors not to pay too much attention to annualized returns over periods much shorter than a year.)
Here is the historical data, as shown in the chart:
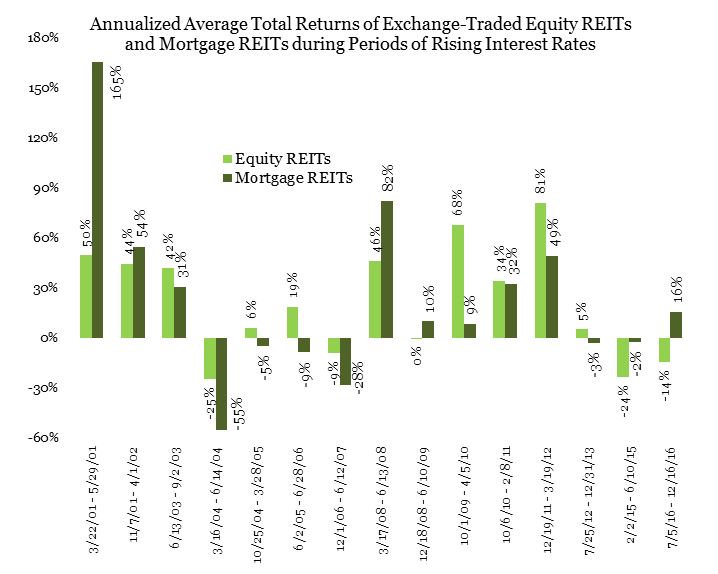
- From March 22 to May 29, 2001 rates increased from 4.73% to 5.54%; equity REITs gained +50% (annualized) while mortgage REITs gained +165%.
- From November 11, 2001 to April 1, 2002 rates increased from 4.22% to 5.44%; equity REITs gained +44%% (annualized) while mortgage REITs gained +54%.
- From June 13 to September 2, 2003 rates increased from 3.13% to 4.61%; equity REITs gained +42% (annualized) while mortgage REITs gained +31%.
- From March 16 to June 14, 2004 rates increased from 3.70% to 4.89%; REITs actually lost ground with equity REITs down -25% (annualized) and mortgage REITs down -55%.
- From October 25, 2004 to March 28, 2005 rates increased from 3.99% to 4.64%; equity REITs gained +6% (annualized) while mortgage REITs were down -5%.
- From June 2, 2005 to June 28, 2006 rates increased from 3.89% to 5.25%; equity REITs gained +19% (annualized) while mortgage REITs were down -9%.
- From December 1, 2006 to June 12, 2007 rates increased from 4.43% to 5.26%; both categories of REITs lost ground with equity REITs down -9% and mortgage REITs down -28%; that six-month period encompassed the peak of the cyclical real estate market plus the first four months of the downturn.
- From March 17 to June 13, 2008 rates increased from 3.34% to 4.27%; equity REITs gained +46% (annualized) while mortgage REITs gained +82%.
- From December 18, 2008 to June 10, 2009 rates increased from 2.08% to 3.98%; equity REITs just barely lost ground at -0.5% (annualized) while mortgage REITs gained +10%; that six-month period encompassed the bottom of the Great Financial Crisis plus the first six months of the cyclical real estate bull market.
- From October 1, 2009 to April 5, 2010 rates increased from 3.21% to 4.01%; equity REITs gained +68% (annualized) while mortgage REITs gained +9%.
- From October 6, 2010 to February 8, 2011 rates increased from 2.41% to 3.75%; equity REITs gained +34% (annualized) while mortgage REITs gained +32%.
- From December 19, 2011 to March 19, 2012 rates increased from 1.82% to 2.39%; equity REITs gained +81% (annualized) while mortgage REITs gained +39%.
- From July 25, 2012 to December 31, 2013 rates increased from 1.43% to 3.04%; equity REITs gained +5% (annualized) while mortgage REITs lost slightly at -3%; that period encompassed the “taper tantrum” of May-June 2013 although rates had been rising for several months before the tantrum and continued rising for several months after.
- From February 2, 2015 to June 10, 2015 rates increased from 1.68% to 2.50%; both segments of the market were down with equity REITs losing -24% (annualized) and mortgage REITs losing -2%.
- From July 5 to December 16, 2016 rates increased from 1.37% to 2.60%; equity REITs were down -14% (annualized) but mortgage REITs gained at +16%.
In case you weren’t keeping score, here’s the summary: investors in Equity REITs enjoyed positive total returns in 10 of the 15 rising-rate environments, while investors in Mortgage REITs reached positive total returns in 9 of the 15.
None of that historical data guarantees that either Equity REITs or Mortgage REITs will continue to post strong returns over any given future period—but you have to admit, the historical record over the past 18+ years has been pretty darned consistent. Remember that interest rates usually increase in response to underlying strength in macroeconomic fundamentals. Remember also that underlying strength in macroeconomic fundamentals usually increases the value of equity assets, including real estate. And remember that owning shares in exchange-traded Equity and Mortgage REITs has usually given investors a way to participate in that growth of value.