Over the last few weeks I’ve published a series of market commentaries focusing on how investors may be able to use the spread between dividend yields on exchange-traded Equity REITs and market yields on other assets—U.S. Treasury securities with 10-year maturities, Baa-rated corporate bonds, and high-quality corporate bonds—to evaluate whether they can anticipate strong average total returns in the future, based on the historical relationship between total returns and the yield spreads at the beginning of each historical period.
That approach is just as valid for investors in exchange-traded Mortgage REITs—that is, REITs whose assets are primarily mortgages and mortgage-backed securities. That’s because the basic premise is simply that yield spreads tend to act as a signal showing when some investors may have mis-allocated capital, perhaps by under-reacting or over-reacting to available market information—and other investors may be able to profit from noticing that signal.
In this commentary, then, I show how the same valuation approach can be used to evaluate current investment opportunities in exchange-traded Mortgage REITs. It’s worth reiterating what always needs to be said when doing an analysis of this type: past performance is no guarantee of future returns, and even a relationship that seems to have held consistently in the past—such as the relationship between yield spreads at any given time and average total returns over the next several years—is not guaranteed to hold in the future.
The headline for the Mortgage REIT industry is a big one: the dividends paid by exchange-traded Mortgage REITs yield 10.54%, on average, as of the beginning of February 2017. In normal times that wouldn’t qualify as remarkable: over the previous 45 years (since NAREIT started recording month-end data in early 1972), mortgage REIT dividend yields have averaged 11.41% and have usually been in the range of 9.58% to 12.97%. But we’re not in normal times: even after a late-2016 increase, the market yields on 10-year U.S. Treasury bonds had crept up only as high as 2.43%.
That means dividends on Mortgage REITs were yielding 8.11 percentage points more, per year, than 10-year Treasuries—on exactly the same day, coincidentally, that the California State Teachers’ Retirement Board (CalSTRS), in response to the continuing low-yield market environment, announced that it would be lowering its overall investment return assumption to 7.0%.
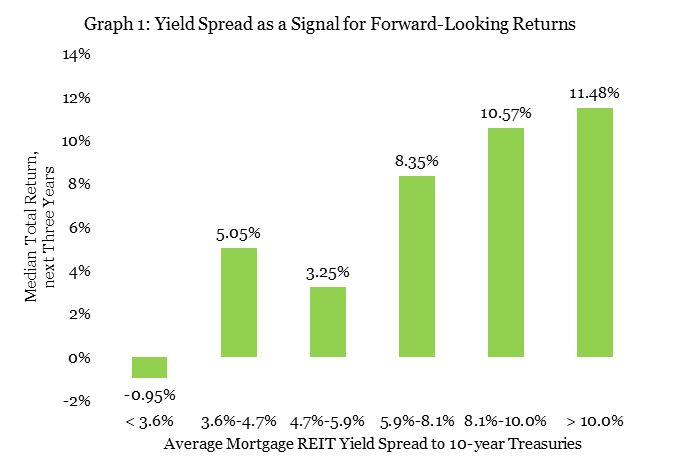
So the key question is this: what can investors make of the high current dividend yields on exchange-traded Mortgage REITs? As a first answer to this question, Chart 1 shows the median annualized total return of Mortgage REITs over the next three years based on their dividend yield spread to 10-year Treasuries at the beginning of that three-year period. When you look at the 32 completed periods (going back to the beginning of 1990, roughly the “modern REIT era”) that started with an average Mortgage REIT dividend yield between 8.1 and 10.0 percentage points higher than the 10-year Treasury yield, over the next three years the total returns on Mortgage REITs tended to average about 10.57% per year. (That was the median value, meaning there were 16 such three-year periods when total returns averaged less than 10.57% per year and another 16 such three-year periods when total returns averaged more than 10.57% per year. The average across those 32 completed three-year periods was 12.13% per year, but the median provided a better fit.)
The categories are defined so that each of them had roughly the same frequency, and you can see that the yield spread at the beginning of February 2017 (8.11%) was just barely into the 8.1% - 10.0% category. In the neighboring category (5.9% - 8.1%), Mortgage REIT total returns averaged about 8.35% per year over the next three years. It’s worth noting that the yield spread topped 10% just one year ago—and over that 12-month period, total returns of Mortgage REITs averaged a stunning 31.73%.
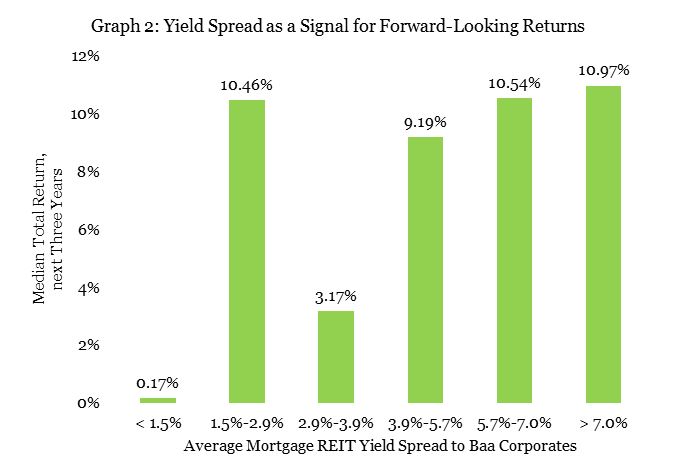
Many analysts believe that the dividend yield spread to Baa-rated corporate bonds has more predictive power than the spread to Treasuries, because the Baa corporate yield more closely matches funding costs for REITs. I repeated the analysis using Moody’s data on Baa corporate yields, and the results are shown in Chart 2. At the beginning of February 2016 the yield on Baa corporates was 4.83%, so the spread was 5.71%. There were 29 completed three-year periods that started with a Mortgage REIT dividend yield spread to Baa corporates in the range of 5.7% - 7.0%, and the median value of the average annualized total return across those 29 completed three-year periods was 10.54%, with an average value of 11.09% per year. (Looking at one-year returns actually provided a slightly better fit to the historical data; the median one-year return was 12.26%, and the average was 14.77%.)
As with the spread to Treasuries, the spread to Baa corporates at the beginning of February was just at the edge of the category, so it’s useful to point out that annualized returns over the next three years had a median value of 9.19% per year—not terribly different—when the beginning-of-period yield spread was in the neighboring range of 3.9% - 5.7%. Also, one year ago (at the end of February 2016) the spread to Baa corporates was in the top category, >7.0%, and as I noted Mortgage REIT total returns over that year were a stunning 31.73%.
Investors shouldn’t think of this sort of analysis as the only information they need to make an investment decision, including one regarding Mortgage REITs: there are many other factors that may be important in determining the success of any investment decision over the next several years. The question I posed at the beginning is a pretty simple one, though: is a current dividend yield in excess of 10% a signal that perhaps investors should look more closely at the investment opportunity in exchange-traded Mortgage REITs? The historical data suggests that the answer should be “yes.”

