Q3 Data Highlights Solid Growth in FFO, NOI, and
How REITs’ Operational Performance Is Keeping Pace with Inflation
WASHINGTON, D.C. (Nov. 15 2022) – REITs’ operations remained strong with solid year-over-year increases in funds from operations (FFO) and net operating income (NOI), as they continue to navigate a period of rising interest rates and persistently high inflation, according to new third quarter data from the Nareit Total REIT Industry Tracker Series (T-Tracker®) report released today.
“There is substantial uncertainty about the outlook for the U.S. economy as the Fed continues to raise rates in an attempt to lower the rate of inflation, but REITs are well-positioned for rising interest rates,” said Nareit Executive Vice President of Research and Investor Outreach John Worth. “Though they have not been immune to the stock market volatility, REITs continue to see earnings growth and to deliver an attractive stream of dividend income to investors.”
Year-over-Year Increases in FFO and NOI Underscore REITs’ Resilience
T-Tracker® data for the third quarter of 2022 show that FFO increased to $19.9 billion—a 0.8% rise from last quarter and a 14.9% increase from one year ago. Eighty-one percent of REITs reported increases in FFO year-over-year. More than half of the sectors also achieved year-over-year FFO growth, including lodging/resorts (125.6%), specialty (32.9%), industrial (30.9%), self storage (27.1%), residential (19.9%), retail (19.9%), and infrastructure (10.5%).
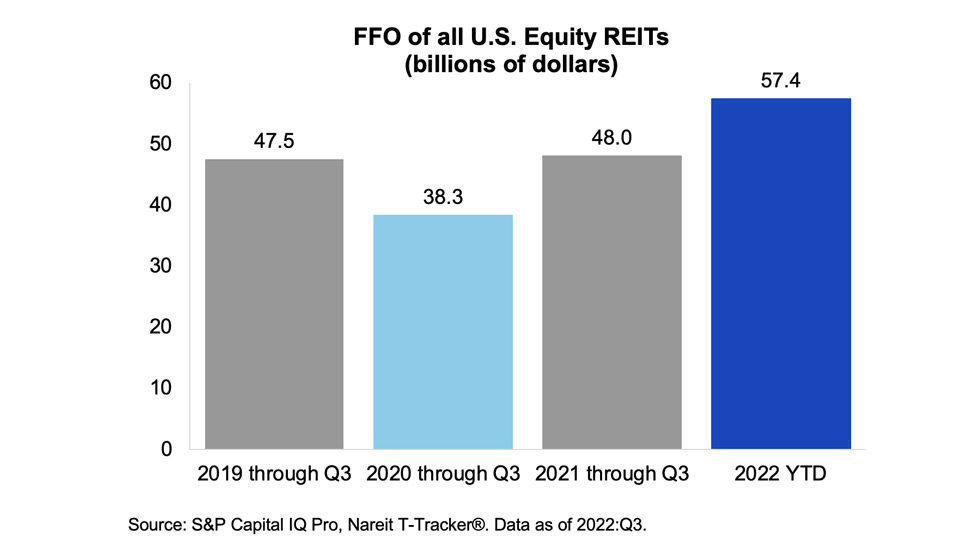
The Q3 T-Tracker® data above—and the chart below—underscore REITs’ resilience. The chart displays aggregate FFO through the third quarter of all U.S. equity REITs in billions of dollars for years 2019 to 2022. The data illustrate how the pandemic took a toll on the operational performance of equity REITs, with aggregate FFO declining by 19.4% from 2019 to 2020. FFO then surpassed its 2019 level in 2021 and reached a new peak in 2022, demonstrating that despite economic headwinds, equity REITs’ operational performance has been resilient.
NOI and Same Store NOI Data Show REITs Keeping Up with Inflation
Meanwhile, T-Tracker® data show that NOI was $27.7 billion, representing an 8.1% increase from a year ago, and that Same Store NOI was $11.8 billion, representing a 7.1% increase over the past four quarters. The data underscore the fact that REITs are keeping pace with inflation.
“Historical data show that real estate has performed well across a variety of inflationary environments,” said Nareit Senior Vice President of Research Ed Pierzak. “On average, both public and private real estate total returns have increased with higher inflation regimes, with REITs tending to outperform their private market counterparts.”
Public and Private Market Cap Rates Are Diverging
Though cap rates do not move in lock step with rising interest rates, the public real estate market has had a meaningful reaction to the surge in 10-year Treasury yields. T-Tracker® data for the third quarter show that REITs had an implied cap rate of 6.0%, which is a significant increase from 4.5% in the fourth quarter of 2021. As of the third quarter of 2022, the REIT implied cap rate exceeded the private real estate cap rate by more than 100 basis points. Notably, REIT performance has typically led private real estate performance by six to 18 months.
REIT Balance Sheets Have Low Levels of Leverage, Well-Structured Debt
REITs remain well-prepared for a period of higher interest rates by maintaining historically low levels of leverage along with well-structured, long-term debt. For example, T-Tracker® data show that:
- Leverage ratios remained near historic lows with debt-to-market assets at 34.5%.
- Fixed rate debt accounted for 82.6% of total debt.
- Interest coverage increased to 6 times.
- Net interest expense as a percent of NOI was near its historical low at 18.9%.
- Weighted average term to maturity of REIT debt was more than 7 years—or 84 months.
For more data, please read the complete Q3 2022 Nareit T-Tracker® report.
